Proven Growth
Proven Growth Through Data-Driven Campaigns
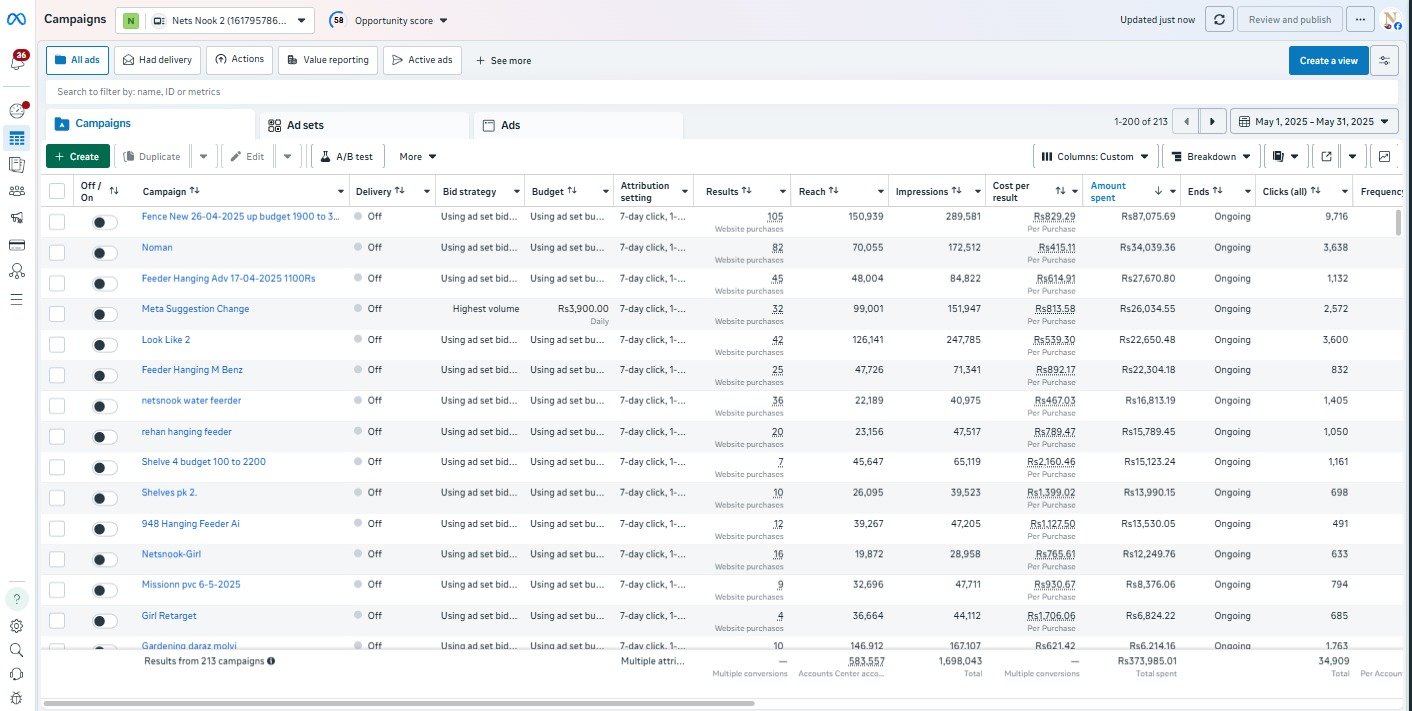
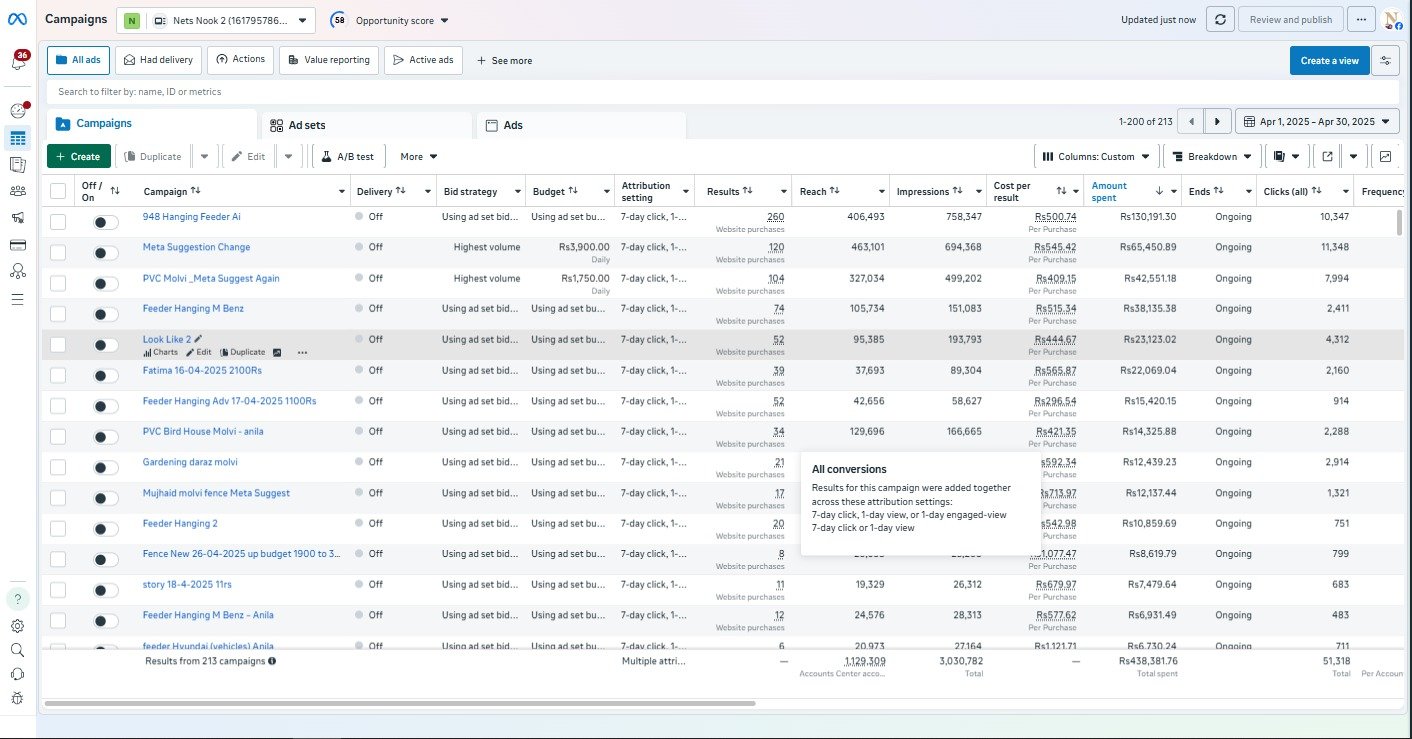
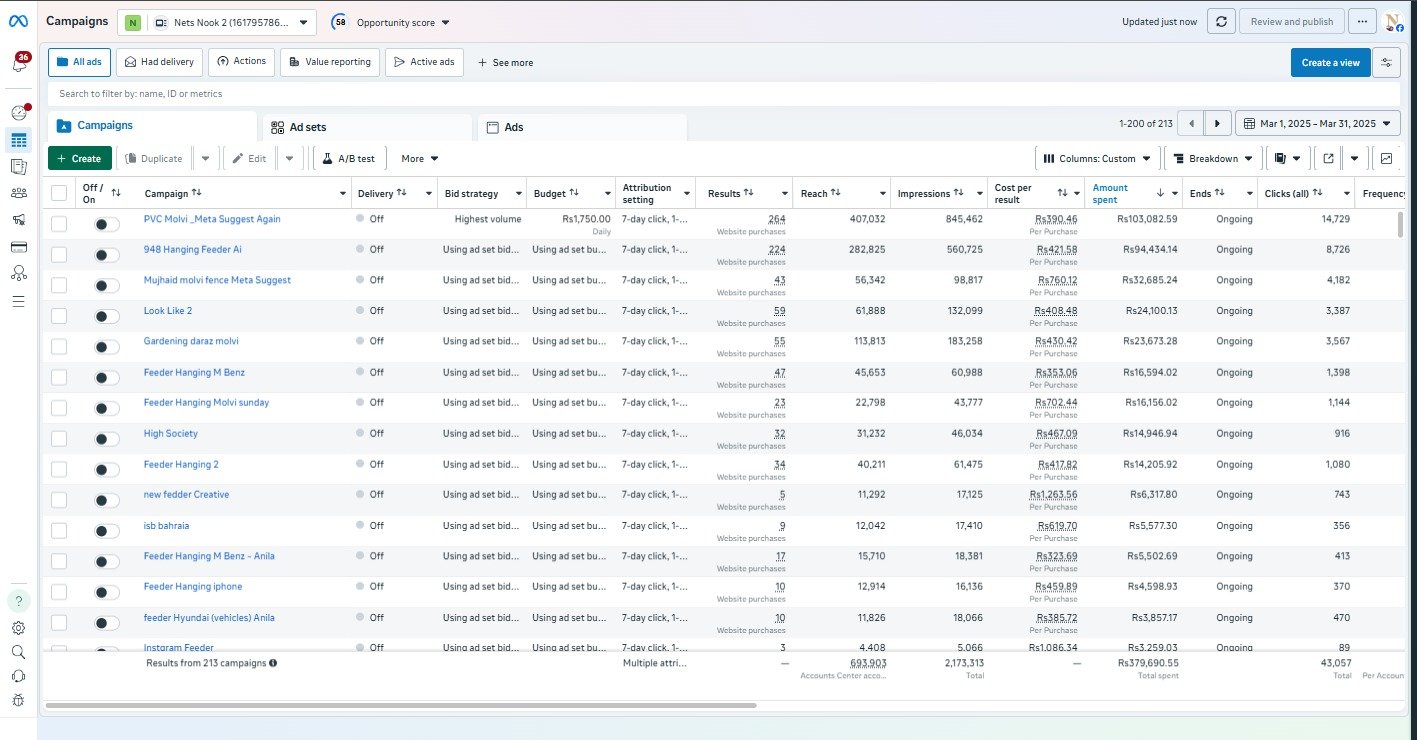
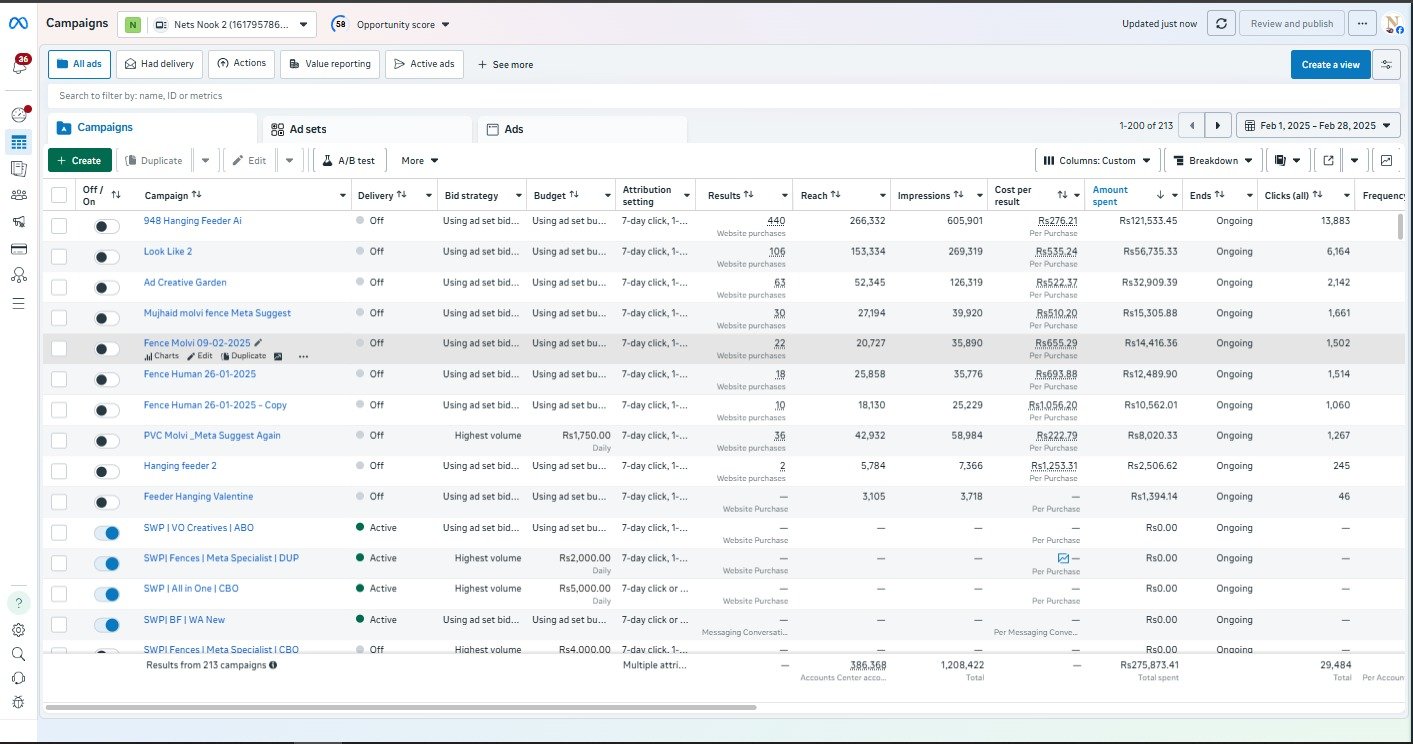
We scaled this store with a strategic ad approach, achieving consistent revenue growth and strong return on ad spend over time.
Revenue Growth
Last 6 MonthsPerformance Breakdown
Month by Month Results
Tracking ad spend, revenue and ROAS over time
| Description | Shopify Plan | TikTok Ads | FB & Instagram | Google Ads/Others | Graphics | Total Market Sum | Product + Shipping | Total Cost | ROAS | Total Revenue | P/L | ROI |
|---|---|---|---|---|---|---|---|---|---|---|---|---|
| Total | - | Rs 3,549,534 | - | - | Rs 4,251,447 | Rs 4,887,267 | Rs 9,138,714 | 3.09x | Rs 10,960,085 | Rs 2,121,501 | 23.21% | |
| Startup Cost | - | - | - | - | - | Rs 66,112 | - | Rs 66,112 | - | - | -Rs 66,112 | - |
| September Cost | Rs 8,000 | - | Rs 80,564 | - | Rs 5,200 | Rs 93,764 | Rs 34,957 | Rs 128,721 | 0.67x | Rs 54,184 | -Rs 74,537 | - |
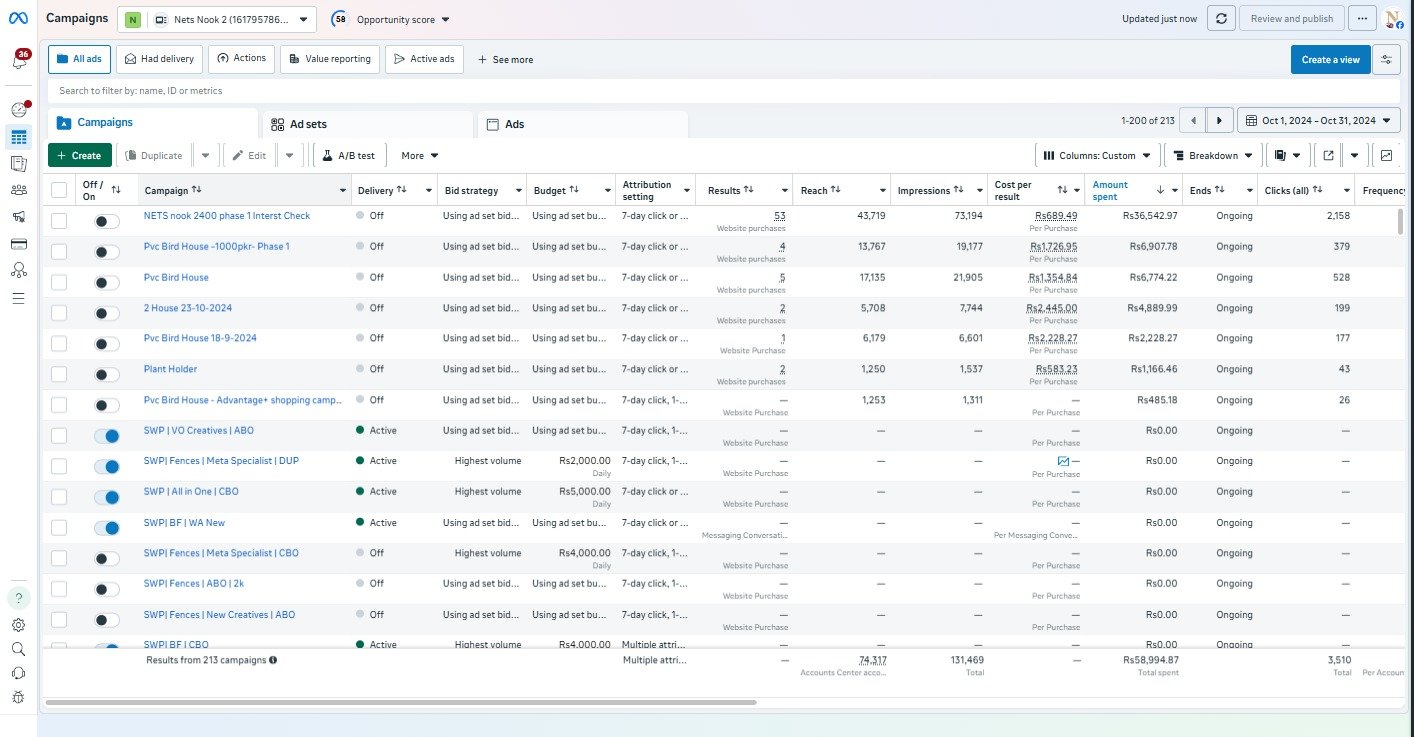
| October | Rs 8,000 | Rs 8,200 | Rs 58,994 | - | - | Rs 75,194 | Rs 71,450 | Rs 146,644 | 2.03x | Rs 119,730 | -Rs 26,914 | - |
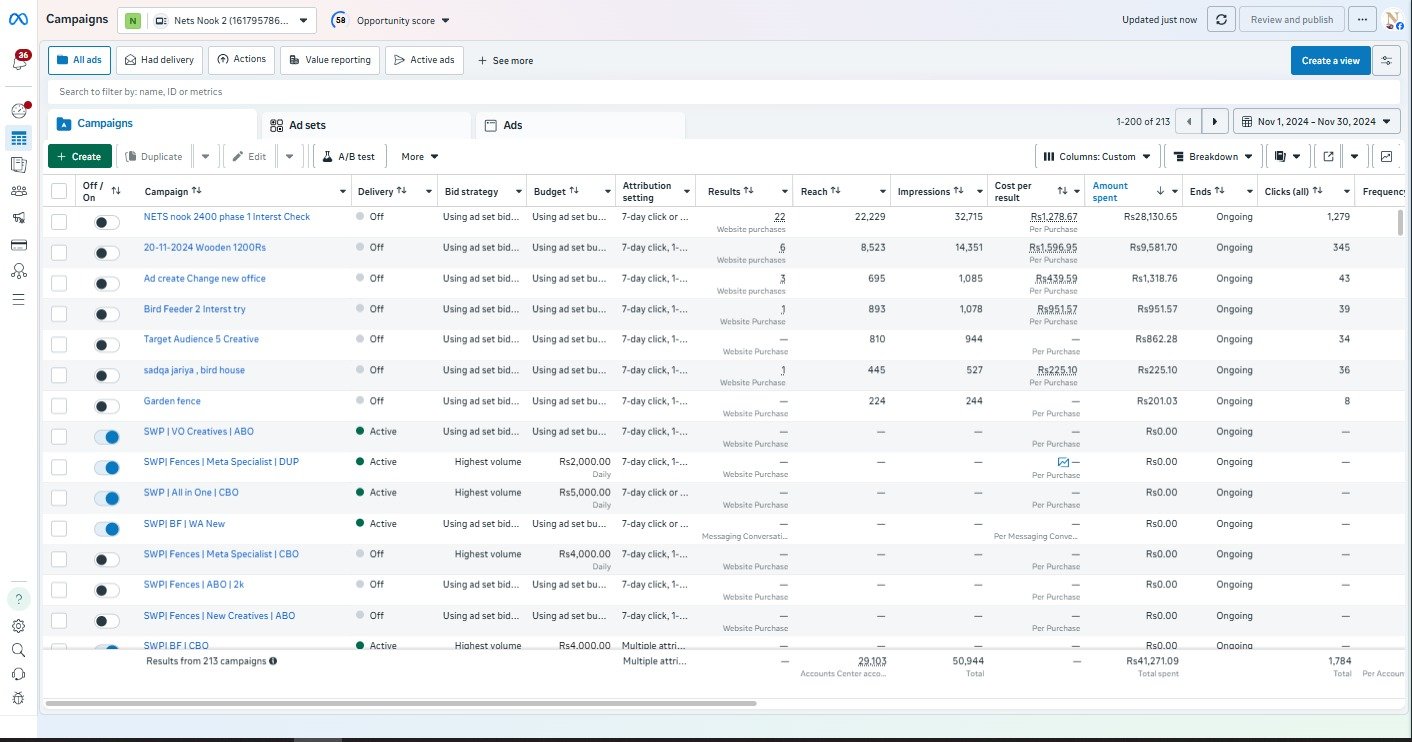
| November | Rs 8,000 | Rs 75,010 | Rs 41,271 | - | Rs 9,500 | Rs 133,781 | Rs 91,170 | Rs 224,951 | 3.92x | Rs 161,932 | -Rs 63,019 | - |
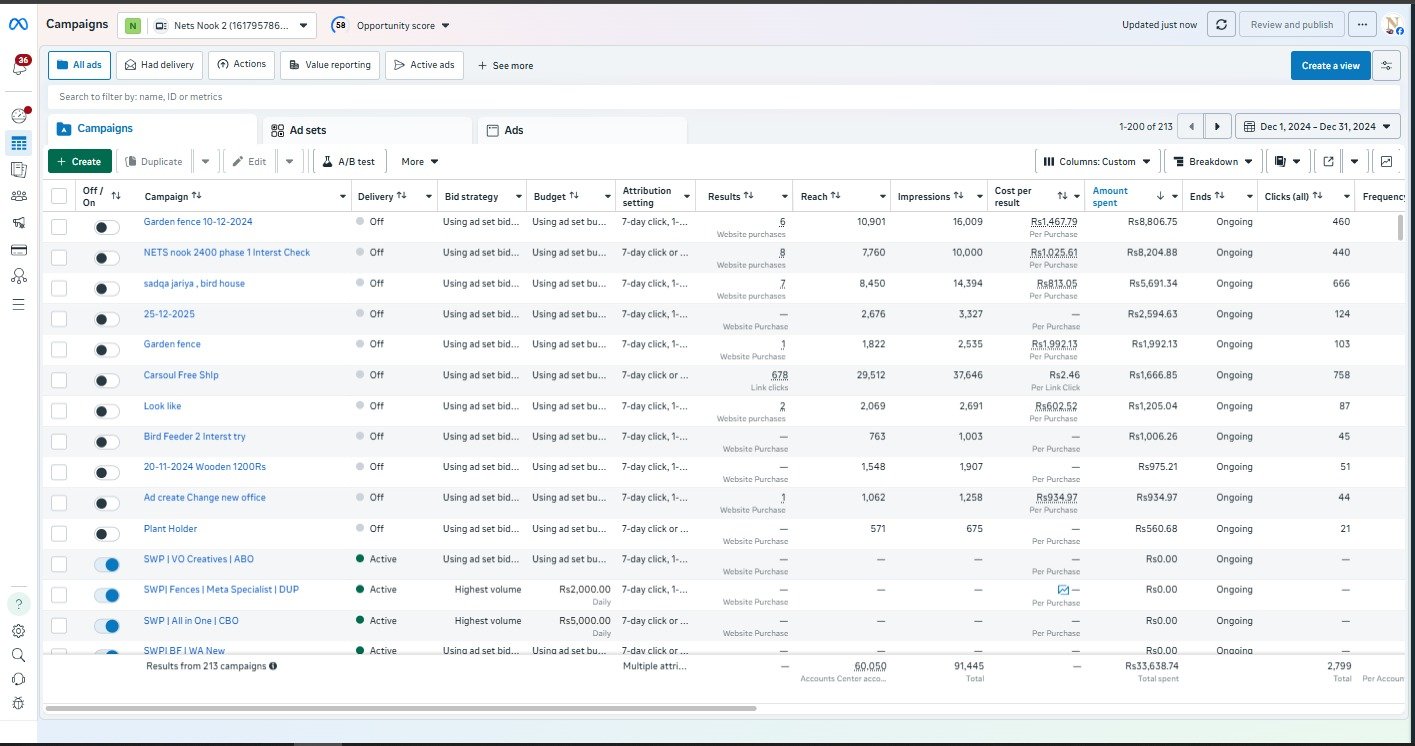
| December | Rs 8,000 | Rs 10,802 | Rs 33,300 | - | - | Rs 52,102 | Rs 42,720 | Rs 94,822 | 2.07x | Rs 68,840 | -Rs 25,982 | - |
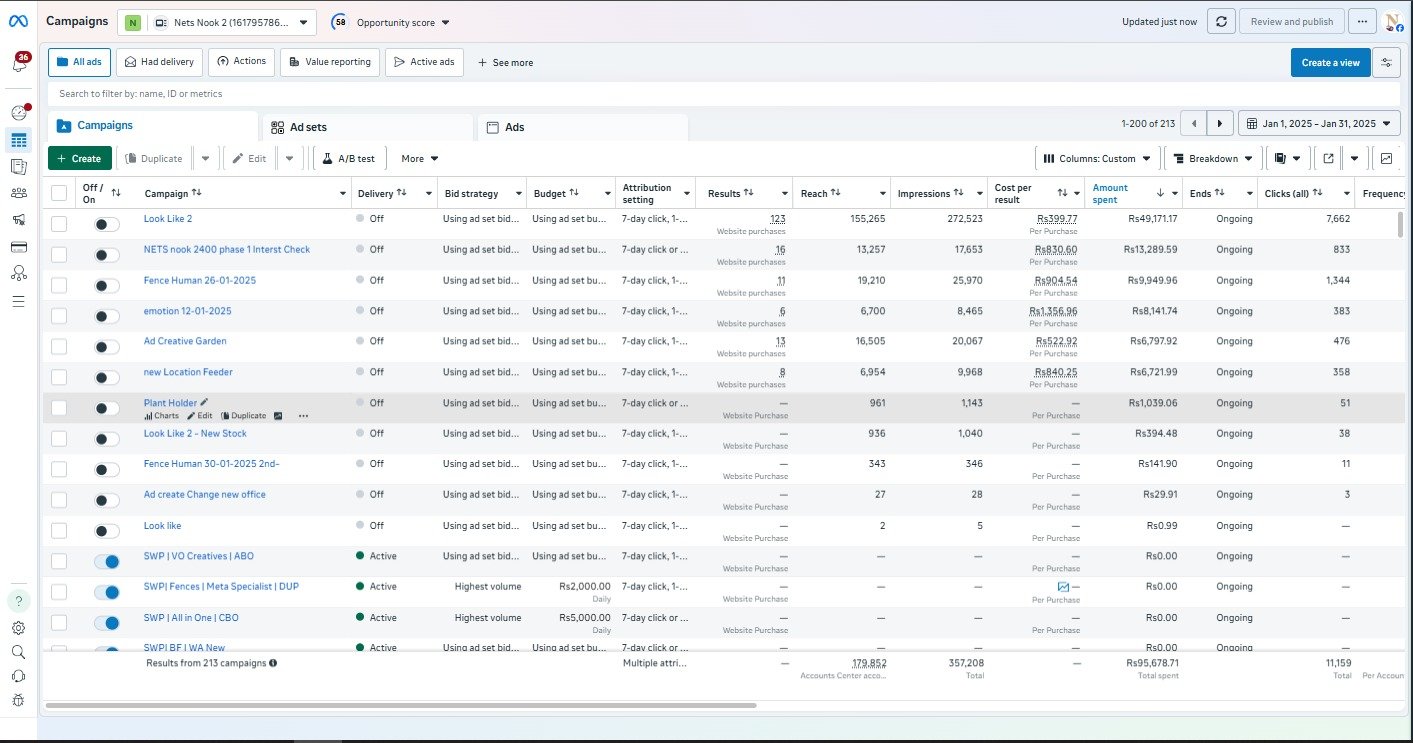
| January 2025 | Rs 8,000 | Rs 3,133 | Rs 98,755 | Rs 6,900 | Rs 8,000 | Rs 124,788 | Rs 208,150 | Rs 332,938 | 3.67x | Rs 362,465 | Rs 29,527 | 8.87% |
| February 2025 | Rs 8,000 | Rs 14,500 | Rs 291,874 | Rs 46,900 | Rs 19,700 | Rs 380,974 | Rs 882,047 | Rs 1,263,021 | 6.91x | Rs 2,016,551 | Rs 753,530 | 59.66% |
| March 2025 | Rs 8,000 | Rs 15,000 | Rs 383,000 | Rs 44,560 | Rs 15,000 | Rs 465,560 | Rs 882,565 | Rs 1,348,125 | 5.33x | Rs 2,042,136 | Rs 694,011 | 51.48% |
| April 2025 | Rs 8,000 | - | Rs 491,730 | - | Rs 40,000 | Rs 539,730 | Rs 884,060 | Rs 1,423,790 | 4.03x | Rs 1,984,004 | Rs 560,214 | 39.35% |
| May 2025 | Rs 8,000 | Rs 32,000 | Rs 401,080 | - | Rs 15,000 | Rs 456,080 | Rs 387,440 | Rs 843,520 | 2.43x | Rs 975,930 | Rs 132,410 | 15.70% |
| June 2025 | Rs 8,000 | - | Rs 311,370 | Rs 3,400 | Rs 21,000 | Rs 343,770 | Rs 350,250 | Rs 694,020 | 2.64x | Rs 820,947 | Rs 126,927 | 18.29% |
| July | Rs 8,000 | Rs 18,000 | Rs 298,871 | Rs 9,468 | Rs 15,000 | Rs 349,339 | Rs 168,231 | Rs 517,570 | 1.53x | Rs 457,000 | -Rs 60,570 | -11.70% |
| August | Rs 8,000 | - | Rs 200,992 | Rs 4,028 | Rs 10,000 | Rs 223,020 | Rs 170,642 | Rs 393,662 | 1.96x | Rs 392,973 | -Rs 689 | -0.18% |
| September 2025 | Rs 8,000 | - | Rs 273,343 | Rs 20,500 | Rs 10,000 | Rs 311,843 | Rs 359,099 | Rs 670,942 | 2.68x | Rs 731,997 | Rs 61,055 | 9.10% |
| October 2025 | Rs 8,000 | - | Rs 307,260 | Rs 10,000 | Rs 10,000 | Rs 335,260 | Rs 354,486 | Rs 689,746 | 2.51x | Rs 771,396 | Rs 81,650 | 11.84% |
| November 2025 | Rs 8,000 | - | Rs 277,130 | - | Rs 15,000 | Rs 300,130 | - | Rs 300,130 | - | - | - | - |
Real Campaign Results That Drive Growth
We track, analyze, and optimize every campaign to deliver measurable results — from ad spend to revenue and conversion rates.
Let’s Build Something
Great Together
Learn, grow, and succeed — all in one place.
Common Questions About E-Commerce Growth
Why do most e-commerce stores face losses in the first few months?
Initial losses happen because you are spending money to buy data and train the ad algorithms. Once the pixel matures and winning ads are found, profitability increases significantly.
What is the difference between ROAS and ROI?
ROAS only measures revenue against ad spend, while ROI calculates actual net profit after all expenses. A positive ROI is the true indicator of a healthy business.
What are the hidden costs in local e-commerce?
Beginners often ignore return shipping (RTOs), packaging, courier fees, and taxes. Always factor in a 15-20% return rate to protect your actual profit margins.
When is the right time to scale your ad budget?
Scale your budget by 20-30% only after maintaining a profitable ROAS for 3-5 consecutive days. Scaling too fast can reset the algorithm and crash your ad performance.
Should I focus on Facebook Ads or TikTok Ads?
Scale your budget by 20-30% only after maintaining a profitable ROAS for 3-5 consecutive days. Scaling too fast can reset the algorithm and crash your ad performance.
Sign up to receive our latest updates
We help learners build practical digital skills through hands-on projects, expert mentorship, and real-world experience
Need some help?
Popular Courses
Need some help?
- Phone : +923060324379
- Email : info@saghirakhtar.com
- Address: Rahim Yar Khan, Punjab